Spring Boot + Prometheus + Grafana: From Zero to Dashboard
Table of Contents
Open Table of Contents
Brief
My goal is to make posts like this the SIMPLEST place on the internet to learn how to do things that caused me trouble. In the Ultimate Guide to Spring Boot Actuator I covered how metrics get produced and exposed at /actuator/prometheus. This post is the other half everyone asks about next: getting from that wall of text metrics to an actual dashboard your team looks at.
The destination: docker compose up -d, start your app, and a fully provisioned Grafana dashboard is live — datasource configured, dashboard imported, zero clicking through UIs. Everything is in the demo repo at github.com/StevenPG/DemosAndArticleContent, including the dashboard JSON you can import into any existing Grafana (direct link).
The Mental Model (60 Seconds)
Three components, one direction of data flow:
- Micrometer (in your app) records metrics and exposes them as a text page at
/actuator/prometheus. - Prometheus pulls that page on an interval (scraping) and stores the values as time series.
- Grafana queries Prometheus with PromQL and draws the results.
The pull model trips people up the first time: your app doesn’t send metrics anywhere. It just answers HTTP GETs. If the dashboard is empty, the debugging order is always: does /actuator/prometheus render → does Prometheus’s targets page show the scrape as UP → does the PromQL return data.
Step 1: The App Side (Two Dependencies)
dependencies {
    implementation("org.springframework.boot:spring-boot-starter-actuator")
    runtimeOnly("io.micrometer:micrometer-registry-prometheus")
}management:
endpoints:
web:
exposure:
include: health,info,prometheus
metrics:
tags:
application: ${spring.application.name}That management.metrics.tags.application line matters more than it looks: it stamps every metric with your app’s name, which is what lets one dashboard serve every service you own via a template variable. Add it on day one; retrofitting tags across services later is miserable.
With just this, you already export ~1,000 useful series for free: JVM memory and GC, HikariCP pool stats, and — most importantly — http_server_requests_seconds, a timer for every endpoint with uri/status/method tags.
Custom Business Metrics
Free metrics tell you the service is healthy; custom metrics tell you the business is. The demo app is a fake checkout that records both:
@RestController
public class CheckoutController {

    private final Counter ordersPlaced;
    private final Counter ordersFailed;
    private final Timer paymentTimer;

    public CheckoutController(MeterRegistry registry) {
        this.ordersPlaced = Counter.builder("shop.orders.placed")
                .description("Successfully placed orders")
                .register(registry);
        this.ordersFailed = Counter.builder("shop.orders.failed")
                .description("Orders that failed payment")
                .register(registry);
        this.paymentTimer = Timer.builder("shop.payment.duration")
                .description("Time spent in the (fake) payment provider")
                .publishPercentileHistogram()
                .register(registry);
    }

    @PostMapping("/checkout")
    Map<String, String> checkout() {
        return paymentTimer.record(() -> {
            // ... call payment provider ...
            ordersPlaced.increment();
            return Map.of("status", "ok");
        });
    }
}
The one non-obvious line is .publishPercentileHistogram(). Without it, you cannot compute p95/p99 across instances in Prometheus — you’d only get pre-aggregated percentiles that can’t be combined. With it, Micrometer exports histogram buckets and Grafana’s histogram_quantile() does the math properly. Any timer you’ll want percentiles for needs this flag.
Step 2: Prometheus (One File)
# docker/prometheus.yml
global:
  scrape_interval: 5s

scrape_configs:
  - job_name: spring-boot
    metrics_path: /actuator/prometheus
    static_configs:
      - targets: ["host.docker.internal:8080"]
host.docker.internal is how a containerized Prometheus reaches the app running on your host during development (paired with extra_hosts: ["host.docker.internal:host-gateway"] in compose for Linux). In Kubernetes you’d swap static_configs for service discovery, but nothing else on this page changes — which is exactly why this local stack is worth building: you learn the real thing.
Step 3: Grafana, Fully Provisioned
Here’s the part that separates this from every “click New Dashboard” tutorial: Grafana supports provisioning — mounting datasources and dashboards as files, so the whole setup is code:
# docker-compose.yml (grafana service)
grafana:
  image: grafana/grafana:12.0.2
  ports: ["3000:3000"]
  volumes:
    - ./docker/grafana/provisioning:/etc/grafana/provisioning:ro
    - ./docker/grafana/dashboards:/var/lib/grafana/dashboards:ro
One small YAML registers the Prometheus datasource, another points at a dashboards directory, and the dashboard itself is a JSON file in the repo. Blow away the container, docker compose up, everything is back. Your dashboards belong in git next to the code that emits the metrics — dashboards configured by hand die with the person who clicked them together.
The Dashboard
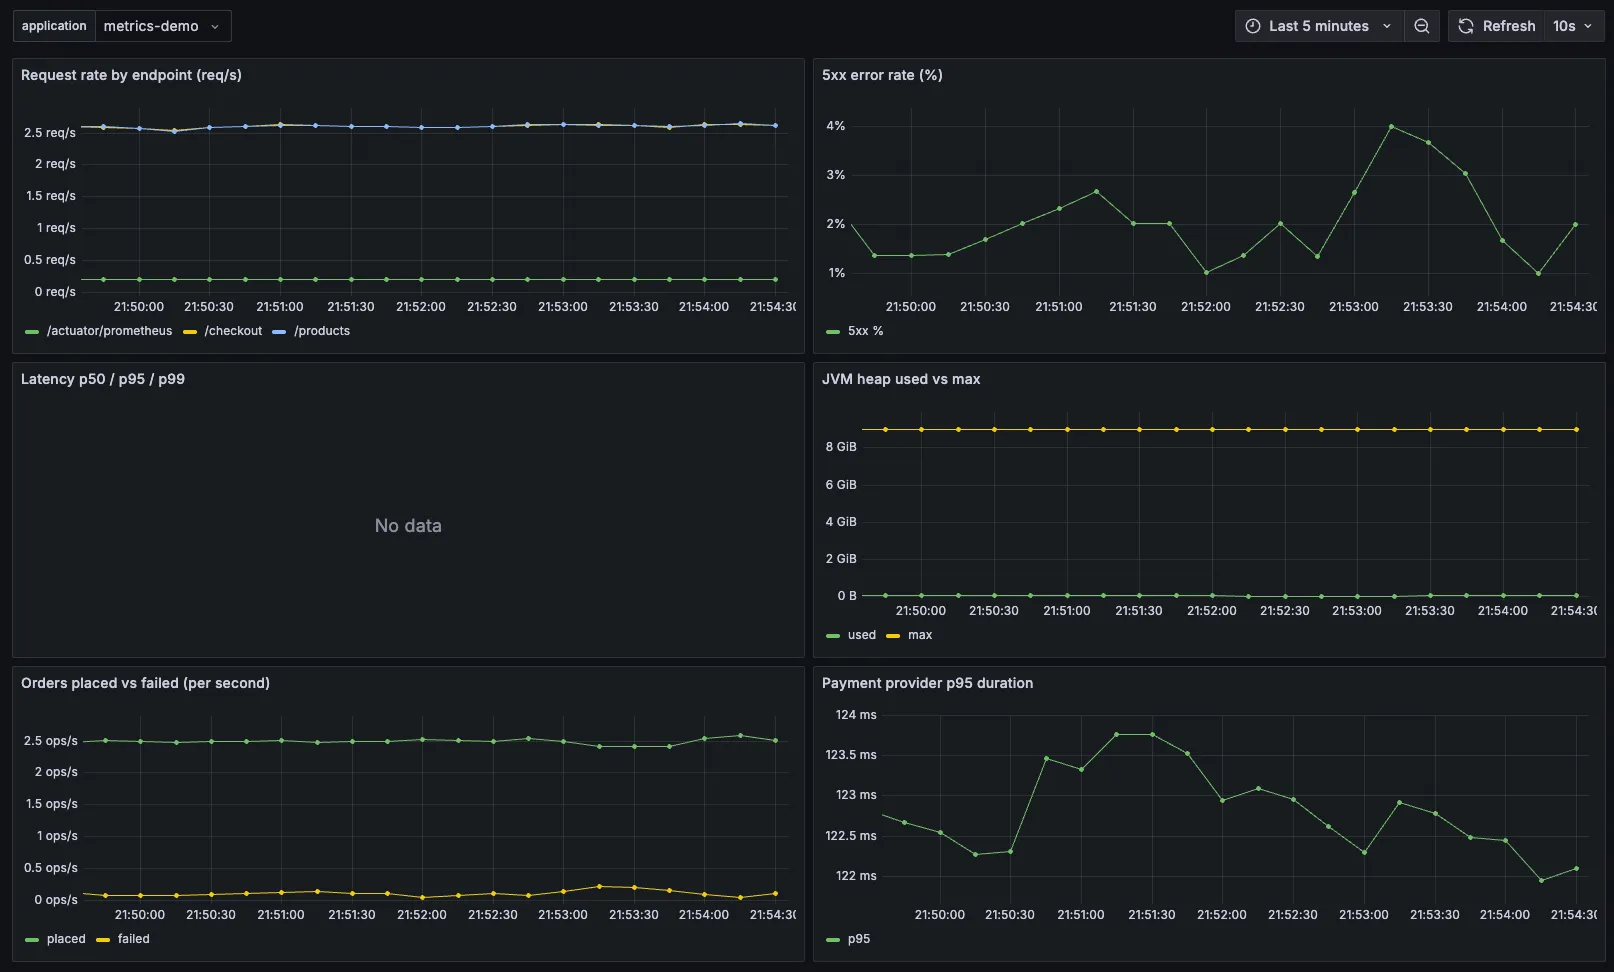
Run the stack and hit localhost:3000 (the demo includes generate-traffic.sh to give it something to show). The provisioned Spring Boot Overview dashboard has six panels, and their PromQL is worth reading because these are the queries you’ll reuse everywhere:
Request rate by endpoint:
sum by (uri) (rate(http_server_requests_seconds_count{application="$application"}[1m]))5xx error rate (%):
100 * sum(rate(http_server_requests_seconds_count{application="$application", status=~"5.."}[1m]))
    / sum(rate(http_server_requests_seconds_count{application="$application"}[1m]))
Latency p95 (this is THE query to memorize):
histogram_quantile(0.95, sum by (le) (rate(http_server_requests_seconds_bucket{application="$application"}[5m])))Plus JVM heap used-vs-max, and the two business panels (orders placed vs failed, payment p95). The $application template variable is populated from the tag we set in step 1 — point the same dashboard at any of your services and it just works.
Import it into your own Grafana: Dashboards → Import → paste spring-boot-overview.json.
Here’s what it looks like:
The Gotchas That Cost Me Time
rate()needs at least two scrapes in its window. A 1m rate window with a 60s scrape interval shows nothing. Keepscrape_intervalat 15s or less, and rate windows at 4x the interval.- Counters end in
_totalin Prometheus (shop.orders.placed→shop_orders_placed_total). Micrometer renames dots to underscores and appends suffixes; when a query returns nothing, check the actual name at/actuator/prometheusfirst. - Never graph a raw counter. It’s a line going up forever. You almost always want
rate(...). - High-cardinality tags will hurt you. A tag per user ID or per request ID multiplies series counts until Prometheus eats all your memory. Tags are for bounded sets: endpoint, status, region.
Summary
Two dependencies and one config block make your Spring Boot app scrapeable; one YAML file each stands up Prometheus and a fully provisioned Grafana; and the dashboard JSON in the repo covers the golden signals plus business metrics with reusable PromQL. Clone the demo, run three commands, and you have the exact observability stack you’ll run in production — just smaller.
For everything upstream of the /actuator/prometheus endpoint — health groups, custom endpoints, securing the management surface — the Actuator Ultimate Guide picks up where this leaves off.